Pick any number you like. If you pick it close to the right answer, the process will be a little quicker, but it doesn't really matter. From the picture below (drawn with Gnuplot), 1 seems like a reasonable starting point.
Now you put cos(1) into your calculator. You don't get 1 back out, so that's not your solution. But if you take cos of that answer, and then cos of that answer and so on for a little while (you can probably do something like just hitting '=' over and over) the answer eventually stops changing. You've found a value which - at least to the accuracy your calculator displays - is it's own cosine. That's the solution. Quite neat! (I think that method is the numerical form of Picard integration, but I could be quite wrong.)
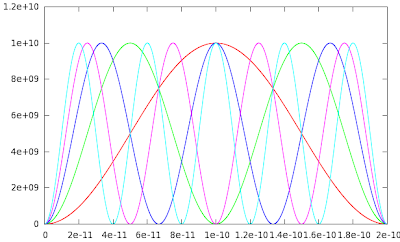
Having started playing with Gnuplot, I don't want to stop, so before I go back to work, why don't I show you a picture of the probability densities we're calculating for the particle-in-a-box problem? It's pretty, at least.
 | |
| Probabilities of finding an electron at different points in an infinite potential well for five different energy states. (I hope.) |


Hi, I was just looking at your Particle in a Box plots,
ReplyDeleteand I was wondering: where are the labels for the x and y axes? Where is the title? In addition to this, where is the key? How do we know which energy state is which? Have you read your checklist for graphs?
Hi Anonymous -- do bear in mind that this was just an image I put up to show my friends and family what I was working on, not a full academic report. Labelling is obviously very important in general, but not so much where I'm just generating some pretty-looking lines. ;)
Delete